Fibonacci retracement levels are among the most-used tools by traders to identify potential support and resistance zones for crypto and equities during market pullbacks.
As its name suggests, this technical indicator is rooted in the Fibonacci sequence, with the levels helping traders spot key areas where a financial asset’s price might pause, reverse, or continue trending.
Even during periods of market trends, prices tend to target specific ranges before moving on to the next region. Fibonacci retracement levels are widely used to analyse potential price targets, confirm an entry level, target a take profit, and determine stop-loss levels.
What are Fibonacci Retracement Levels?
To simplify, Fibonacci retracement levels are horizontal lines on a price chart that indicate potential support or resistance levels where a crypto or security’s price may reverse following a pullback.
These levels – commonly 23.6%, 38.2%, 50%, 61.8%, and 78.6% – are derived from the Fibonacci sequence, discovered by mathematician Leonardo Pisano Bogolla in the 1400s. They are used to identify possible areas where price corrections might end and the original trend resumes, and align with market psychology, support and resistance zones, and technical indicators like moving averages.
The 23.6% level is a shallow retracement level, often signalling strong momentum, while 38.2% suggests a moderate pullback and is frequently seen in trending markets. 50% is not a Fibonacci ratio but is widely used as a psychological and technical benchmark for asset prices. 61.8%, also known as the “golden ratio,” is considered the most significant and reliable Fibonacci level. Meanwhile, 78.6% is derived from the square root of 61.8%, often suggesting deeper retracements.
How are Fibonacci Retracement Levels Calculated?
A financial asset’s Fibonacci retracement levels are calculated by identifying a significant price swing – swing high and swing low – and then applying the Fibonacci ratios to the price range. In an uptrend, the levels act as potential support, but in a downtrend, they act as resistance. Traders use the levels to plan market entries, set stop-losses, and determine potential profit targets – often combining them with other technical tools like RSI, moving averages, or chart patterns for confirmation analysis.
The formula for calculating the level is:
Low Price + ((High Price – Low Price) x Fibonacci Percentage)
For example, if a stock or crypto’s price rises from $100 to $200, then its 50% retacement will be calculated as:
$200 – (($200 – $100) x 0.5) = $150
How Does Fibonacci Retracement Levels Work?
To apply the Fibonacci retracement levels, traders need to identify the market trend first – whether the asset or the general market is in an uptrend, with higher highs and higher lows, or in a downtrend, with lower highs and lower lows.
Once the trend is identified, traders would choose the swing high and swing lows as reference points to calculate the retracement levels. Most trading platforms provide tools that automatically generate the key price levels, including the 38.2%, 50%, 61.8%, and 78.6%. These levels act as potential support in uptrends and resistance during downtrends, helping traders anticipate price actions.
While shallow retracements, such as 38.2%, suggest strong momentum, deeper retracements, such as the 78.6%, may indicate potential trend reversals during volatile market conditions.
How to Apply Fibonacci Retracement Levels in Trading?
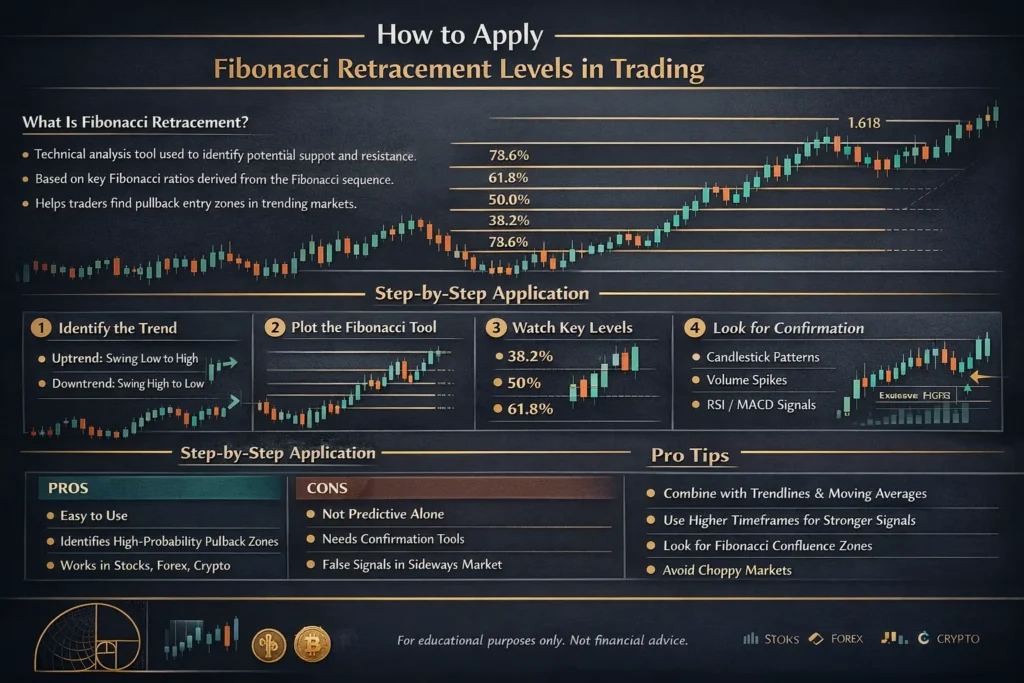
When it comes to trading, the Fibonacci retracement levels are used to identify price entry points. The 38.2%, 50%, and 61.8% levels are the most commonly watched zones for potential trend reversals.
During an uptrend, traders look for price pullbacks, as well as bullish confirmation signals like candlestick patterns or relative strength index (RSI) indicators to identify oversold conditions and enter long positions. In a downtrend, traders wait for the price throwback toward a Fibonacci resistance level and confirm bearish momentum before entering short positions.
In order to manage their risk, traders place stop-loss orders just beyond the next Fibonacci level to prevent getting liquidated from normal price fluctuations while protecting themselves against unexpected trend reversals. Fibonacci extensions are used for targeting profit levels and are projected after the asset resumes its overall trend. Key extensions include 100%, 161.8%, and 261.8%.
Limitations of Fibonacci Retracement Levels
While Fibonacci retracement levels are a popular technical tool among traders, they aren’t foolproof and have their own limitations. The biggest challenge it faces is the subjectivity in selecting swing points, as different traders choose different high and low points, resulting in conflicting retracement levels.
Prediction levels for the Fibonacci retracement levels are low, as prices can break through the points instead of reversing as expected. Their effectiveness also depends on market conditions, as they work best during an uptrend and are unreliable during volatile periods.
There is also the potential for showing false signals and breakouts where the price briefly reaches a Fibonacci level before continuing in the opposite direction. This could lead to premature stop-loss triggers and poor trade execution. If multiple retracement levels are grouped closely together, then chances are that the price may react unpredictably, causing confusion.
Confirmation bias is also another drawback of the Fibonacci retracement levels, which occurs when traders force the levels onto their charts and choose to see only what supports their conviction.
Fibonacci Retracement Levels: Final Thoughts
Fibonacci retracement levels are some of the most effective trading tools when used alongside other technical indicators and market analysis. While they provide a structured approach to identifying a financial asset’s support and resistance levels, traders should remain flexible, confirm signals, and be mindful of the indicator’s limitations, including the potential for false signals.
")
")

