
The Simple Moving Average (SMA) is a technical analysis tool that allows traders to understand price trends of financial assets by smoothing out price data. It can be leveraged across stocks, forex, crypto, and commodities.
It calculates the average price of an asset, such as a stock or cryptocurrency, over a specific number of past periods; thereby reducing short-term volatility and revealing the underlying market trend.
In this article, we shall discuss everything you need to know about the Simple Moving Average (SMA), how it is calculated, and how it can be applied to maximize your trading profits.
So, without further ado, let’s get started.
What Is the Simple Moving Average (SMA)?
The Simple Moving Average (SMA) is a technical indicator that traders use to calculate an asset’s average price over a specific period. It can help improve traders’ navigation of price movements in the market by giving equal weight to each data point. This makes the SMA a true average finder.
Traders typically use SMA to smooth out price data, reduce noise, and identify trend direction. Other moving averages, like the Exponential Moving Average (EMA) and Weighted Moving Average (WMA), focus more on recent prices of an asset, making them responsive to the latest information. Whereas, the SMA’s equal weighting results in a much smoother trend line but a slower reaction time to real-time price changes.
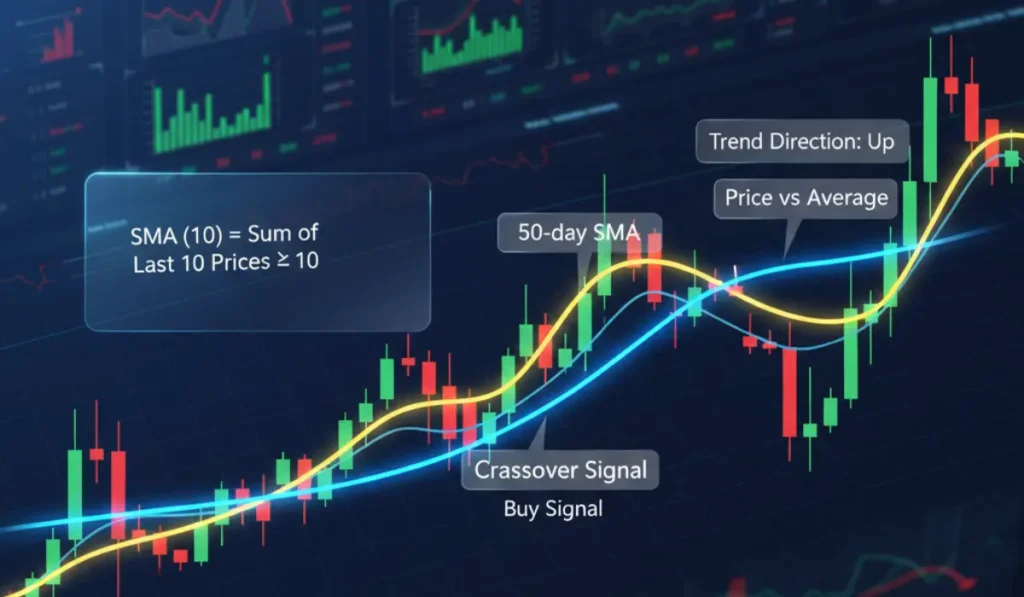
To simplify, SMA is the process of finding the average price of an asset over several days. The formula for calculating a simple moving average is:
SMA = (A1 + A2 + … + An) / n
- ‘n’ is the total number of periods
- ‘A’ is the price of the asset on the given day
- ‘An’ is the price of the asset at period ‘n.’
How To Calculate a Simple Moving Average (SMA)?
To calculate a 5-day SMA for a crypto or a stock, you add the closing prices for a period of the previous five days, and divide that total by five. Let’s take an example to understand how this technical indicator works.
Imagine that you are tracking the average price of Token A for the past week. Here, you will be calculating the 7-day SMA of the asset by adding up the prices over the last seven days.
Suppose, Token A’s price during the trading week was: $3.50 (Monday), $3.45 (Tuesday), $3.55 (Wednesday), $3.60 (Thursday), $3.50 (Friday), $3.40 (Saturday), and $3.55 (Sunday). Their sum will be $21.05. Now, divide that number by 7, giving you the 7-day SMA of $3.007 for Token A. This smoothed average helps you analyze whether the price of Token A is generally trending upwards or downwards, rather than getting caught up in daily fluctuations.
Key Characteristics of SMA
Here are the key characteristics that define Simple Moving Average’s (SMA) behavior as a technical trading indicator:
- Equal Weighting: The SMA assigns an equal weight to every data point in its calculation period. This means the price of the asset on day 1 has the same impact as the price on day 50 in a 50-day SMA. This is in contrast to EMA and WMA, which focus more on the most recent price movements.
- Lagging Nature: The SMA follows price trends rather than predicting them. It is often described as a “lagging indicator” because it is based on past prices; hence, its signals are often delayed. This lag is more profound in longer-term SMAs, such as the 200-day SMA, than in shorter-term averages like the 20-day SMA.
- Flexibility in Timeframe: Traders can apply the SMA to any timeframe, ranging from short-term intraday charts to long-term weekly or monthly charts. Shorter SMAs react more quickly to price changes and are better suited for short-term analysis. Meanwhile, longer SMAs provide a broader view of the market’s long-term trend.
How Does Simple Moving Average Work?
There are three primary ways in which traders analyze market trends and generate trading signals using SMA.
1. Trend Identification
The direction of the SMA line indicates the market trend. If the trendline is upward-sloping, then it suggests an uptrend, while a downward-sloping SMA indicates a downtrend. However, if the SMA is flatlining or moving sideways, then it implies a ranging market.
2. Dynamic Support and Resistance Levels
The SMA line often serves as a dynamic level of support or resistance for an asset. During an uptrend, the price may pull back and bounce off the SMA, treating it as a support level. Meanwhile, in a downward trend, the price may rally to the SMA and then find its resistance level.
3. Entry and Exit Signals
A crossover event occurs when the asset’s price moves from one side of the SMA line to the other, signalling a potential trend change. A bullish crossover happens when the price moves above the SMA, suggesting an entry signal. Whereas, a bearish crossover occurs when the price falls below the SMA, suggesting an exit or short-term signal.
Types of SMAs Used In Trading
Three types of SMAs greatly influence the effectiveness of your trading strategy, and they are the following:
1. Short-Term SMA
Short-term SMAs typically cover a period of 10 to 20 days. They react quickly to recent price movements, making them apt for traders who focus on intraday or swing trading strategies.
They capture short-term momentum shifts and are sensitive to recent price action. Traders mainly use short-term SMAs to spot quick trend reversals, identify entry and exit points, and manage their active positions.
2. Medium-Term SMA
Medium-term SMAs generally span around 50 days, and are less sensitive to price action than short-term SMAs. It helps traders identify intermediate trends that develop over several weeks to a couple of months.
They help smooth out short-term volatility while still being responsive enough to detect meaningful trend changes. It is mainly used by traders who prefer holding their positions for weeks or months, and is popular among swing and position traders.
3. Long-Term SMA
Longer-term SMAs generally cover periods of 100 or 200 days. They are designed to capture the broad, underlying market trend over several months or years. It provides a macro view of the market direction, helping investors understand the overall health and momentum of an asset or its market.
It is commonly used by long-term investors and trend followers to confirm major trends and avoid premature trades.
SMA Trading Strategies
Here are some of the most common and effective Simple Moving Average (SMA) trading strategies:
- Golden Cross (Bullish): A Golden Cross occurs when the short-term SMA (50-day SMA) crosses above a longer-term SMA (200-day SMA). This is a powerful bullish signal that indicates the start of a major long-term uptrend.
- Death Cross (Bearish): A Death Cross happens when a shorter-term SMA crosses below a longer-term SMA, suggesting a bearish trend in the market. It is often described as the potential of a major long-term downtrend.
- Price/SMA Crossover: In this SMA strategy, traders wait for the price to cross above or below a single SMA. A move above the SMA is a buy signal, while a drop below is a sell signal. This crossover is most effective when the market is trending. However, it can produce false signals during sideways markets.
- SMA Bounce: During a strong uptrend, traders can use the SMA as a dynamic support level. The game plan here is to buy the asset when the price pulls back to the SMA line, and sell when it bounces off the SMA to resume its upward move. The reverse is true during a downtrend, when the SMA acts as resistance.
How Can SMA Be Applied in Different Markets?
SMA is a versatile technical tool that is applicable across various asset classes:
- Stocks: In the stock market, traders rely on the 50-day and 200-day SMAs to analyze the market trend. It is mainly used to identify long-term trends and generate Golden Cross or Death Cross signals.
- Forex: In forex trading, traders often use short-term SMAs, like the 10-day, 20-day, and 50-day, on intraday charts (1 hour or 4 hours) to understand quick trend movements among currency pairs.
- Cryptocurrencies: Since the crypto market is highly volatile, traders tend to use a combination of a short-term SMA (10-day) to ride the positive momentum and a long-term SMA (50-day) to define the overall trend.
- Commodities: When dealing with commodity futures, the SMA is used to help identify sustained trends driven by supply and demand factors. Traders commonly leverage long-term SMAs like the 100-day or 200-day.
Read More: What Are Blue-Chip Stocks? Are They Safe for Beginners?
Advantages and Disadvantages of SMA
Now let’s take a look at the advantages and disadvantages of using the Simple Moving Average as part of your trading strategy.
Advantages
- The SMA is easy to calculate and understand. This makes it an excellent starting point for those beginning their trading journey.
- It filters out random, short-term price fluctuations, thereby providing a clearer view of the underlying market trend.
- SMA is a reliable tool for confirming the direction and strength of long-term market trends.
Disadvantages
- Since it is based on past price data, the SMA tends to react after the market has already started its trend. This can lead to delayed entry and exit signals.
- During sideways or ranging markets, the price can frequently cross back and forth over the SMA, resulting in the generation of numerous fake signals, also known as “whipsaws”.
- The SMA’s equal weighting to data points gives the same importance to old price data as it does to newer ones. Critics often argue that this makes it inefficient.
Conclusion
The Simple Moving Average (SMA) smoothens price actions, providing traders with a clear signal for market trends, as well as the support and resistance levels of an asset. It is a technical trading tool that is among the easiest to understand, yet remains a core tool for experienced traders.
However, it is recommended that you use the SMA with other technical indicators like the RSI or MACD to achieve the best results. It is also advised that traders first practise the strategy on a demo account before trading live.
")
")

