Technical indicators help investors make more informed decisions by analyzing price action, volume, momentum, and market trends. Rather than relying on emotion or speculation, investors use technical indicators to identify potential entry and exit points, confirm trends, and manage risk more effectively. Technical indicators primarily fall into two categories: overlays, which plot over prices on a chart, and oscillators, which fluctuate between defined limits above or below a price chart. This article further discusses the role of technical indicators for an investor. So, keep reading to learn more.
Why Technical Indicators Matter For Investors
One of the biggest advantages of technical indicators is their ability to bring structure and consistency to investing decisions. Markets move based on supply and demand, and technical indicators visualize this behavior in a way that is easier to interpret. This is especially useful during periods of high volatility, when emotional decision-making often leads to costly mistakes.
Technical indicators also help investors:
- Identify trends early and stay in profitable trades longer.
- Spot overbought and oversold conditions before reversals occur.
- Confirm price movements using volume and momentum signals.
- Improve timing for buying and selling assets.
- Reduce risk by setting clearer stop-loss and take-profit levels.
For long-term investors, technical indicators help with fundamental analysis by improving entry timing and avoiding poor market conditions. For active traders, they act as essential tools for short-term decision-making and trade execution. Ultimately, technical indicators don’t predict the future; they increase probability. When used correctly and in combination, they help investors trade with logic, discipline, and confidence instead of guesswork.
Common Mistakes Investors Make With Technical Indicators
Many traders rely on technical indicators so much that they forget or avoid the fact that all indicators are derived from price. So, using indicators means you are adding an extra layer of analysis between the price and yourself. Some of the common mistakes investors make include overloading charts with too many, leading to conflicting signals and confusion. Other major mistakes to avoid are:
- Poor decision-making due to using too many indicators.
- Ignoring price action and focusing solely on indicators rather than the actual price.
- Over-reliance on one tool, which can fail or give false signals.
- Failing to understand the underlying logic of an indicator.
- Relying only on daily charts and ignoring weekly or higher timeframes.
- Ignoring risk management, which can lead to large, preventable losses.
- Overtrading, often out of boredom or emotional impulsivity, increases risk and transaction fees.
- Chasing the market-entering trades too late after a significant move, leaving little room for profit.
Choosing The Right Technical Indicators
Before choosing any indicator, ensure you use a minimal set of indicators that complement each other. Confirm the price and see that it aligns with key support and resistance levels. In addition, always check higher timeframes to confirm the main trend and define exit points to stop losses before entering a trade. Choosing the right indicator involves matching tools to your trading style and combining different types, such as trend, momentum, volatility, and volume, to confirm, rather than duplicate, signals. Try focusing on simple indicators to avoid analysis paralysis.
Some of the key principles for selecting technical indicators include:
- Choose indicators based on what you want to measure.
- Ensure the tools match your timeframe and approach.
- Select indicators that provide different information to avoid contradictory signals.
- Understand key categories.
- Test on a demo account to ensure they work in your chosen market conditions.
Final Thoughts
Technical indicators play a crucial role for traders and investors, as they help to forecast future price movements of securities. They also provide valuable insights into market trends. In a nutshell, they are the trading discipline employed to identify trading opportunities and evaluate a security’s strength and weakness. Understanding and applying these tools effectively can help traders enhance their decision-making process.
FAQs
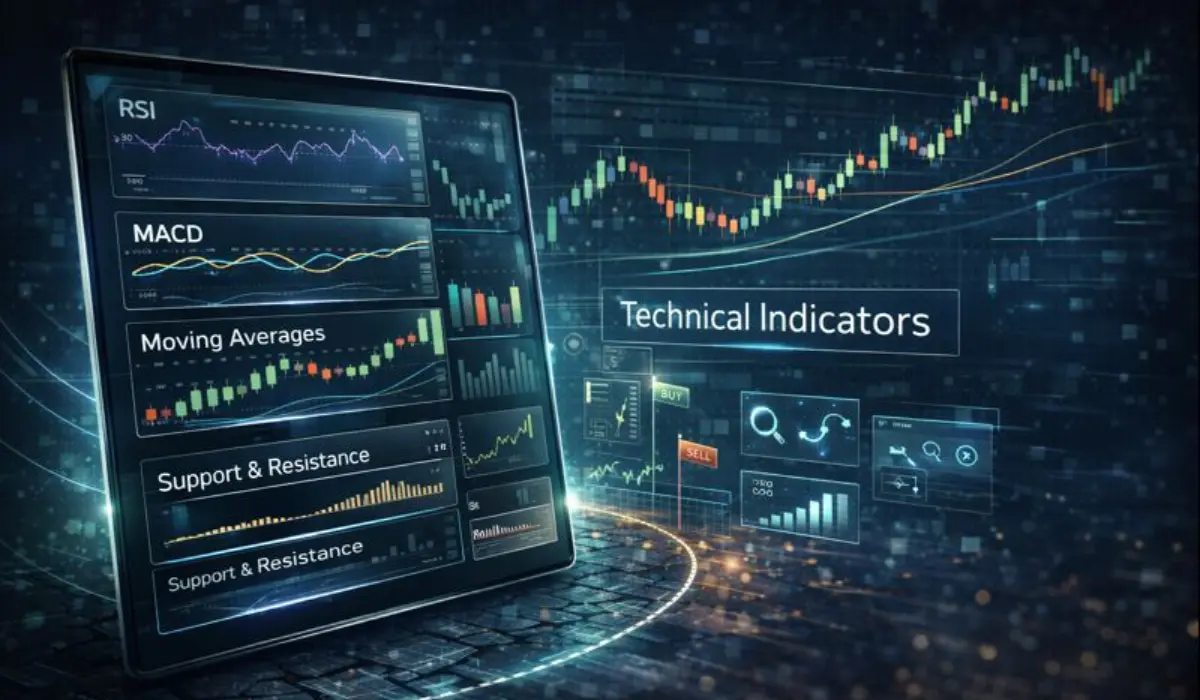
There are many technical analysis indicators, and some of the best ones include the Relative Strength Index (RSI), Moving Average Convergence Divergence (MACD), Moving Averages (SMA/EMA), Bollinger Bands, and On-Balance Volume (OBV).
Technical indicators are mathematical calculations based on security price, volume, or open interest, used by investors to analyze market trends, momentum, volatility, and predict future price movements.
No. Relying on just one indicator is generally not recommended, as it often leads to poor decisions or missed opportunities due to incomplete information.
The Relative Strength Index (RSI) is primarily a leading indicator, designed to signal potential price reversals by identifying overbought or oversold conditions before they fully occur. However, it also acts as a lagging tool, confirming trends after price moves.
")
")

