The Price-to-Book Ratio is a widely used estimate in the corporate world to analyse whether a company’s market price is reasonable compared to its balance sheet. It helps identify potential investments within the market.
The ratio compares a company’s market capitalization to its book value. This beginner’s guide on P/B ratio expands on one of the key tools in the business world, the knowledge of which can help you make informed investment choices in the future.
Price-to-Book Ratio Explained
Price-to-Book (P/B) Ratio is a key valuation metric that compares a company’s market price per share to its book value per share, revealing whether a stock is trading below, at, or above its net asset value. It is a core tool in value investing, used to identify potentially undervalued companies.
It is most useful for analysing capital-intensive industries such as banking, insurance, and real estate, where tangible assets are a major part of value, in contrast to high-growth tech companies with significant intangible assets (e.g., software, intellectual property).
How to Calculate Price-to-Book Ratio
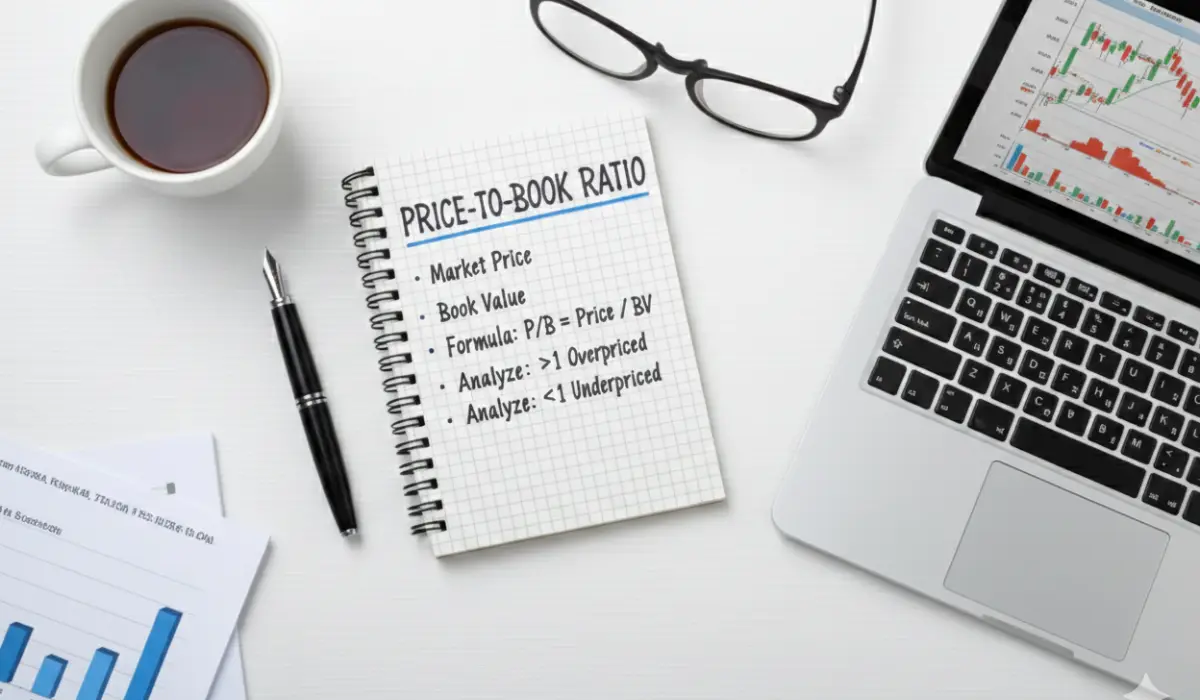
The P/B Ratio is determined by dividing the company’s market price per share by its book value per share.
P/B ratio = Market Price per Share / Book Value per Share
The book value can be calculated as follows:
Book Value per Share = (Total Assets – Total Liabilities)/ Number of Outstanding Shares
This ratio helps investors assess whether a stock is undervalued (P/B < 1) or overvalued (P/B > 1), but should be compared within the same industry and combined with other financial metrics for a complete analysis.
Bargain or Bust? Analysing Value Using the P/B Ratio
- P/B < 1.0: The stock is trading below its book value, often signaling a potential bargain. This is especially relevant for asset-heavy industries like banking, manufacturing, and real estate.
- P/B = 1.0: The market values the company at its net asset value, suggesting fair valuation.
- P/B > 1.0: The market values the company above its book value, reflecting expectations of future growth, strong intangible assets (e.g., brand, patents), or market optimism.
However, a low P/B ratio isn’t always a sign of a bargain. It can also indicate financial distress, poor asset quality, or declining prospects. Conversely, a high P/B may reflect strong growth potential, but it can also signal overvaluation if future earnings don’t materialize.
The P/B ratio is most effective when used alongside other metrics like Return on Equity (ROE) and industry benchmarks. A low P/B with high ROE suggests a strong value opportunity, while a high P/B with low ROE may indicate overvaluation.
P/B vs. P/E Ratio: Which One Should You Use?
 Ratio A Beginner’s Guide to Valuation (1)")
| Price-to-Book (P/B) Ratio | Price-to-Earnings (P/E) Ratio |
| Compares a company’s market price to its book value (net assets), reflecting how much investors are paying for each dollar of net assets. | Measures a company’s stock price relative to its earnings per share (EPS), indicating how much investors are willing to pay for each dollar of earnings. |
| It is especially useful for asset-heavy industries like banking, real estate, and manufacturing, where balance sheet strength and asset value are critical. | It is ideal for companies with steady, predictable earnings, such as consumer goods or technology firms |
| Valuable for evaluating loss-making companies, as it does not rely on earnings. | Helps assess growth expectations and valuation based on profitability. |
Conclusion
Price-to-Book (P/B) Ratio is a financial metric that compares a company’s market value to its book value, helping investors assess whether a stock is overvalued or undervalued.
However, the P/B ratio does not account for future earnings potential, brand strength, or market conditions. In the same way, a low P/B ratio isn’t a foolproof indicator of a successful investment. Thorough fundamental analysis using other industry benchmarks is crucial before making any investment decision.
FAQs
- Why is the P/B ratio higher in tech companies than in banks?
Tech companies have higher P/B ratios than banks because their value is driven by intangible assets like intellectual property, software, and growth potential, which are not fully reflected in book value.
- Which industries have the lowest P/B ratios?
Industries with the lowest P/B ratios include Energy, Utilities, and Banking, largely due to their high tangible asset bases and lower growth expectations, which result in market prices trading closer to or below book value.
- How do you identify undervalued stocks?
A P/B ratio under 1.0 is an indicator of potentially undervalued stocks. However, it must be cross-checked with other fundamental deciding factors for a fair evaluation of the company’s assets.
- Is a high P/B ratio good or bad?
A high P/B ratio can indicate strong growth potential. However, a high P/B ratio may also signal that a stock is overvalued, especially if the company has weak earnings or low return on equity (ROE). Therefore, a high P/B ratio alone cannot be the sole judge of a company’s market value.
")
")

