While stock trading involves navigating an array of complex metrics, it becomes increasingly helpful if there are mathematical tools built into the trading system to help indicate the mechanics of the price. Indicators are the tools that are generally used to achieve this projection. They are basically categorized into four main classes: Trend, Momentum, Volatility, and Volume indicators.
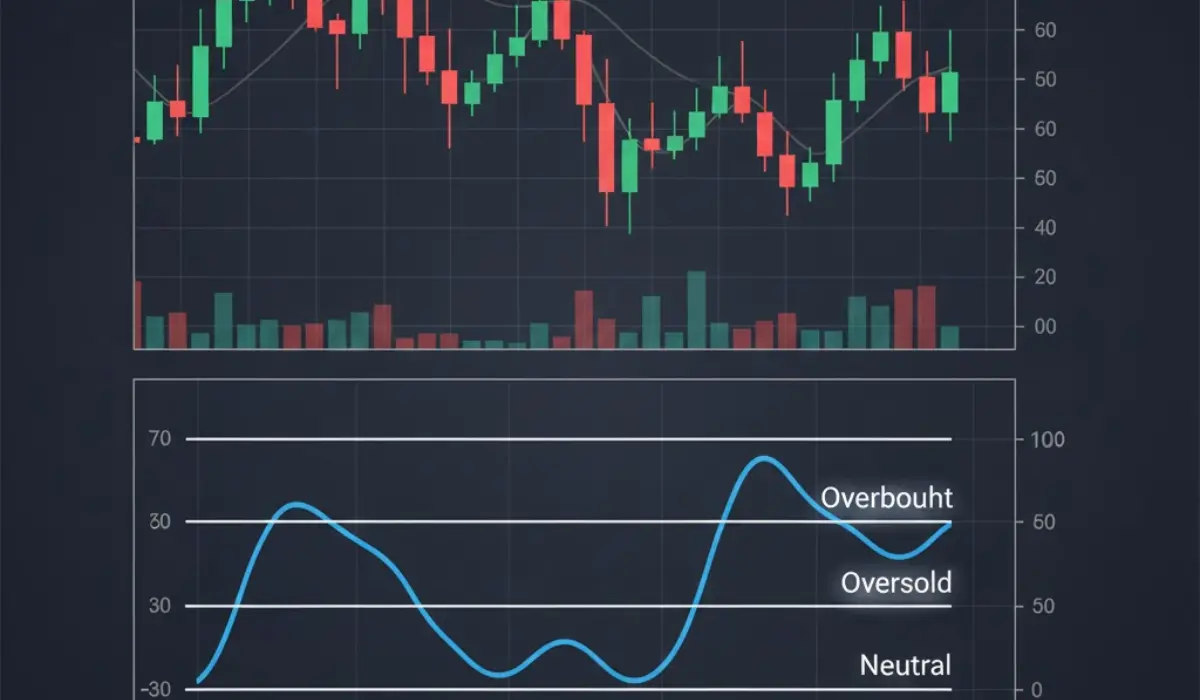
The Relative Strength Index, or RSI, is a momentum indicator. More precisely, it is a momentum oscillator that gives traders insights about the speed and change of price. The values in the RSI indicator range from 0 to 100. This range marks whether the market is in oversold or overbought condition. When the price crosses the level 70 on the RSI indicator, it is considered to be overbought, and when the price goes below the level 30 on the indicator, it is considered oversold.
Overbought and Oversold Conditions
These conditions define whether an asset’s price has moved too far or too fast in one concentrated direction. This means that the market could soon be in for a reversal from its present position. This reversal is known as price correction. While oscillators are generally used to identify these conditions, the RSI remains one of the most common and effective indicators of this market condition.
An asset is considered to be overbought when its price has risen significantly and at a high speed. This is then suggestive of the fact that this particular asset may be trading at a price higher than its fair or intrinsic value. An overbought condition results from excessive buying pressure or strong bullish momentum.
Conversely to what was said above, in an oversold condition, the price will have fallen sharply and quickly, trading below its perceived intrinsic value. An oversold condition could arise courtesy of increased selling pressure. This pressure may be because of panic selling or market overreactions. An oversold market implies that the market may be in for a reversal. That means the price could once again be on the path of a bull run.
Trend Confirmation On RSI
If investors are to use the RSI indicator properly, they have to make the right trend confirmation on the RSI indicator. While it is commonly considered to have overbought conditions when the RSI value is above 70, and oversold when the RSI value is below 30, this may not always be the case, as RSI inherently has an accuracy problem.
A better position to make a trend confirmation is right below the 70 level, somewhere along the 50 value for the overbought condition, and the value below 40 is considered a stable trend indicator for oversold conditions. Even these levels can sometimes misrepresent the data, and investors may read the wrong information. Hence, trend confirmation on RSI is an important part of using the indicator properly.
Normally, investors are inclined to use RSI indicators with the 70-30 level in trending markets. However, during more sideways markets, if this indicator is to work properly, there is a need for its adjustment to the said levels. While the RSI indicator is a great tool during trending markets, the same cannot be said about sideways markets. The sideways market often makes the RSI indicator an unreliable tool, which has to be used in tandem with other indicators to get better results.
Parting Thoughts: The Limitations of the RSI Indicator
One of the major limitations of the RSI indicator is that it is bound to the long-term market. It is better to use RSI in long-term analysis since the true reversal signals are rare and can be difficult to spot.
The RSI indicator is notorious for making false alarms; it can generate a false positive, like a bullish crossover, but the price then suddenly takes a dip. RSI can indicate false negatives as well, for instance, a bearish crossover followed by a sudden upward surge. In both these conditions, the result is the opposite of that of the forecast, and this can lead to problems.
The RSI indicator is especially useful in an oscillating market as it can stay on par with the changes in trend. As long as the market is oscillating between a bullish and bearish region, the RSI indicator remains extremely useful. In markets other than these, the RSI indicator is not the most effective or reliable indicator.
FAQs
A good RSI indicator consists of the trader using the standard 70-30 levels. However, a more effective setup would be to combine the RSI with divergence signals, centerline crossovers, and failure swings for more accurate trend confirmation.
Trend prediction using RSI divergence is a risky and aggressive strategy. For instance, while the price is plotting lower lows on a downtrend, the RSI is plotting higher lows indicate that the downtrend is weakening.
If the RSI used to measure the momentum is calibrated such that the data is the last 14 trading periods(days, hours, minutes, etc.), it is what is referred to as RSI 14.
If the RSI used to measure the momentum is calibrated such that the data is the last 14 trading periods(days, hours, minutes, etc.), it is what is referred to as RSI 14.
While both are momentum indicators, through techniques like RSI divergence, the RSI can help time market entry, making it the better indicator.
While both are momentum indicators, through techniques like RSI divergence, the RSI can help time market entry, making it the better indicator.
")
")

